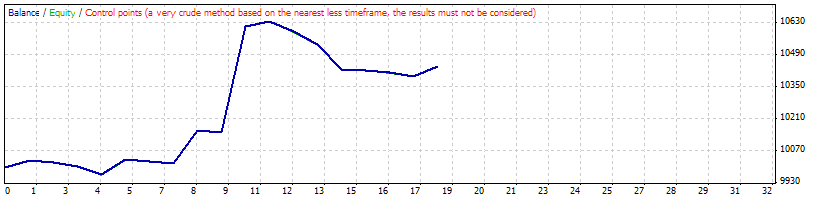
Strategy Tester Report
AlpariUK-Demo (Build 225)
| Symbol | EURUSD (Euro vs US Dollar) | ||||
| Period | 1 Hour (H1) 2009.08.03 01:00 - 2009.10.01 00:00 (2009.08.01 - 2009.10.01) | ||||
| Model | Control points (a very crude method, the results must not be considered) | ||||
| Parameters | S1="---------------- Entry Settings"; VIX_Period=22; VIX_BuyLevel=1; VIX_SellLevel=1; S2="---------------- Money Management"; Lots=0.1; RiskMM=false; RiskPercent=1; Martingale=false; Multiplier=2; MinLots=0.01; MaxLots=100; S3="---------------- Order Management"; StopLoss=0; TakeProfit=0; HideSL=false; HideTP=false; TrailingStop=0; TrailingStep=0; TrailingProfit=0; BreakEven=0; MaxOrders=100; Slippage=3; Magic=2009; S6="---------------- Extras"; Hedge=false; HedgeSL=0; HedgeTP=0; ReverseSystem=false; | ||||
| Bars in test | 1124 | Ticks modelled | 25909 | Modelling quality | n/a |
| Mismatched charts errors | 7 | ||||
| Initial deposit | 10000.00 | ||||
| Total net profit | 439.34 | Gross profit | 766.16 | Gross loss | -326.82 |
| Profit factor | 2.34 | Expected payoff | 24.41 | ||
| Absolute drawdown | 62.88 | Maximal drawdown | 420.50 (3.91%) | Relative drawdown | 3.91% (420.50) |
| Total trades | 18 | Short positions (won %) | 9 (33.33%) | Long positions (won %) | 9 (33.33%) |
| Profit trades (% of total) | 6 (33.33%) | Loss trades (% of total) | 12 (66.67%) | ||
| Largest | profit trade | 462.84 | loss trade | -109.54 | |
| Average | profit trade | 127.69 | loss trade | -27.23 | |
| Maximum | consecutive wins (profit in money) | 2 (485.24) | consecutive losses (loss in money) | 6 (-240.24) | |
| Maximal | consecutive profit (count of wins) | 485.24 (2) | consecutive loss (count of losses) | -240.24 (6) | |
| Average | consecutive wins | 1 | consecutive losses | 3 | |
| # | Time | Type | Order | Size | Price | S / L | T / P | Profit | Balance |
| 1 | 2009.08.07 17:00 | sell | 1 | 0.10 | 1.42067 | 0.00000 | 0.00000 | ||
| 2 | 2009.08.10 15:00 | buy | 2 | 0.10 | 1.41776 | 0.00000 | 0.00000 | ||
| 3 | 2009.08.10 15:00 | close | 1 | 0.10 | 1.41776 | 0.00000 | 0.00000 | 29.00 | 10029.00 |
| 4 | 2009.08.14 21:00 | sell | 3 | 0.10 | 1.41704 | 0.00000 | 0.00000 | ||
| 5 | 2009.08.14 21:00 | close | 2 | 0.10 | 1.41704 | 0.00000 | 0.00000 | -7.44 | 10021.56 |
| 6 | 2009.08.14 22:00 | buy | 4 | 0.10 | 1.41902 | 0.00000 | 0.00000 | ||
| 7 | 2009.08.14 22:00 | close | 3 | 0.10 | 1.41902 | 0.00000 | 0.00000 | -19.80 | 10001.76 |
| 8 | 2009.08.17 03:00 | sell | 5 | 0.10 | 1.41537 | 0.00000 | 0.00000 | ||
| 9 | 2009.08.17 03:00 | close | 4 | 0.10 | 1.41537 | 0.00000 | 0.00000 | -36.54 | 9965.22 |
| 10 | 2009.08.17 18:00 | buy | 6 | 0.10 | 1.40881 | 0.00000 | 0.00000 | ||
| 11 | 2009.08.17 18:00 | close | 5 | 0.10 | 1.40881 | 0.00000 | 0.00000 | 65.60 | 10030.82 |
| 12 | 2009.08.17 19:00 | sell | 7 | 0.10 | 1.40822 | 0.00000 | 0.00000 | ||
| 13 | 2009.08.17 19:00 | close | 6 | 0.10 | 1.40822 | 0.00000 | 0.00000 | -5.90 | 10024.92 |
| 14 | 2009.08.17 20:00 | buy | 8 | 0.10 | 1.40898 | 0.00000 | 0.00000 | ||
| 15 | 2009.08.17 20:00 | close | 7 | 0.10 | 1.40898 | 0.00000 | 0.00000 | -7.60 | 10017.32 |
| 16 | 2009.09.01 18:00 | sell | 9 | 0.10 | 1.42338 | 0.00000 | 0.00000 | ||
| 17 | 2009.09.01 18:00 | close | 8 | 0.10 | 1.42338 | 0.00000 | 0.00000 | 143.40 | 10160.72 |
| 18 | 2009.09.02 09:00 | buy | 10 | 0.10 | 1.42430 | 0.00000 | 0.00000 | ||
| 19 | 2009.09.02 09:00 | close | 9 | 0.10 | 1.42430 | 0.00000 | 0.00000 | -9.30 | 10151.42 |
| 20 | 2009.09.24 17:00 | sell | 11 | 0.10 | 1.47068 | 0.00000 | 0.00000 | ||
| 21 | 2009.09.24 17:00 | close | 10 | 0.10 | 1.47068 | 0.00000 | 0.00000 | 462.84 | 10614.26 |
| 22 | 2009.09.24 19:00 | buy | 12 | 0.10 | 1.46844 | 0.00000 | 0.00000 | ||
| 23 | 2009.09.24 19:00 | close | 11 | 0.10 | 1.46844 | 0.00000 | 0.00000 | 22.40 | 10636.66 |
| 24 | 2009.09.24 20:00 | sell | 13 | 0.10 | 1.46383 | 0.00000 | 0.00000 | ||
| 25 | 2009.09.24 20:00 | close | 12 | 0.10 | 1.46383 | 0.00000 | 0.00000 | -46.10 | 10590.56 |
| 26 | 2009.09.25 08:00 | buy | 14 | 0.10 | 1.46947 | 0.00000 | 0.00000 | ||
| 27 | 2009.09.25 08:00 | close | 13 | 0.10 | 1.46947 | 0.00000 | 0.00000 | -56.50 | 10534.06 |
| 28 | 2009.09.28 04:00 | sell | 15 | 0.10 | 1.45852 | 0.00000 | 0.00000 | ||
| 29 | 2009.09.28 04:00 | close | 14 | 0.10 | 1.45852 | 0.00000 | 0.00000 | -109.54 | 10424.52 |
| 30 | 2009.09.28 05:00 | buy | 16 | 0.10 | 1.45876 | 0.00000 | 0.00000 | ||
| 31 | 2009.09.28 05:00 | close | 15 | 0.10 | 1.45876 | 0.00000 | 0.00000 | -2.40 | 10422.12 |
| 32 | 2009.09.28 06:00 | sell | 17 | 0.10 | 1.45777 | 0.00000 | 0.00000 | ||
| 33 | 2009.09.28 06:00 | close | 16 | 0.10 | 1.45777 | 0.00000 | 0.00000 | -9.90 | 10412.22 |
| 34 | 2009.09.28 08:00 | buy | 18 | 0.10 | 1.45935 | 0.00000 | 0.00000 | ||
| 35 | 2009.09.28 08:00 | close | 17 | 0.10 | 1.45935 | 0.00000 | 0.00000 | -15.80 | 10396.42 |
| 36 | 2009.09.30 23:59 | close at stop | 18 | 0.10 | 1.46365 | 0.00000 | 0.00000 | 42.92 | 10439.34 |